Everyone is currently playing with Google Data Studio. However, there is also an alternative reporting combination which no one is using: Supermetrics for Google Sheets & Power BI from Microsoft. So let’s have a look on this solution. In this article, I will cover some advantages and disadvantages of this combination and I will walk you through setup process of sample report.
Important disclaimer: I am not saying Google Data Studio is bad. It’s probably good enough for 99% users. The aim of this article is to show some extras which you cannot do in Data Studio while you can do them Power BI.
Pros & Cons
Let’s start with pros & cons when doing reporting with Supermetrics for Google Sheets & Power BI combo.
Pros
- Using this setup allows you to create more complex dashboards in Power BI than those in Google Data Studio
- Power BI has the Query Editor which is basically Power Query which you can find in Excel. The differences are only minor. Power Query is super cool because it allows you do data transformations (groupings, filters, custom columns, joins, appends etc.) before you visualize the data. Google Data Studio expects clean data before you start working with then. Power BI will take anything and allow you to clean your dataset first.
- You can use DAX within Power BI. DAX in the “next level” of advanced Excel formulas. You can create metrics such as “Clicks in the Last 30 Days”, “Clicks in the Last 60 Days”. You cannot do this in Data Studio.
- Power BI allows you to select any element on your page and filter all visuals on the page according to your selection.
Cons
- Power BI is not “totally free” unlike Google Data Studio. You basically need to pay $9.99 to get “usable version” of Power BI which allows you to update your reports running on online Power BI servers. There is also a “totally free” version of Power BI for desktop, but you cannot schedule automatic updates.
- You need to pay for Supermetrics for Google Sheets as well
- The initial setup is more difficult
- You need to use Google Sheets as your imaginary “data warehouse”. Google Sheets can only carry 2 millions cells within 1 file. You may hit the limit at some point if your reports are too big.
- There is no Power BI for Desktop available for Mac users.
Sample Report in Power BI
I will now demonstrate how you can make use of Supermetrics for Google Sheets & Power BI combo. I will be working sampled & annonymized data. To keep it simple, I will just by reporting Impressions from 2 data sources.
The goal will be simple. We will create a day-by-day report combining campaign level data from Bing Ads and Google AdWords.
Getting the Data with Supermetrics
The assumption here is that you have already paid for Supermetrics for Google Sheets license. Open a new Google Sheet file. Then load the Supermetrics window via “Add-ons” menu. Select your Data source, accounts, time range, metrics, splits and filters. Don’t forget set higher number of “rows to fetch” than what the reality will be, otherwise you’ll be missing some rows.

The press the blue “Get Data to Table” button at the top. The data will load:

Ideally, remove all the empty columns – the empty cells would otherwise count towards your 2 million cell quota.
Repeat the same procedure with Google AdWords data. Create a new sheet. Open Supermetrics, setup your AdWords query. Use same date range, ideally same metrics, same “split by”.
Your data will load:

Schedule automated data refresh within the Supermetrics add-on by navigating to Add-Ons>Supermetrics>Schedule refresh & emailing:

Power BI
We need to start with few words about Power BI workflow which is different than in Google Data Studio. The typical scenario is:
- Open Power BI for Desktop
- Connect to data sources
- Clean up the data – e. g. filter only specific campaigns in the Query Editor
- Transform the data – e. g. add custom columns in the Query Editor
- Load your “data”
- Create your data model (e.g. by connecting the data from PPC engines to a custom calendar which has data attributes such Week Of, Month, Year, Quarter etc.).
- Design the dashboard visuals
- Publish to “Power BI online UI”
- Setup automatic refreshes in Power BI online
- Share your report within your organization
As you can see, there are 3 important pieces in the puzzle when it comes to Power BI world. There is Power BI for Desktop which is a standalone application designed to help you go through the development process of your dashboards. Within this application, there is so called “Query Editor” which is basically the same set of features as in Power Query in standard Excel. And then there is “Power BI online UI” which is mostly for presenting the dashboards and sharing across your organization. In order to publish to Power BI online UI from your Power BI for Desktop, you obviously need to create a Power BI account.
Download Power BI for Desktop here. Install and Open it. You will see something like:

Click the highlighted “Get data” button. Search for “Web” data source:

Hit “Connect button”. You will be asked for an URL:
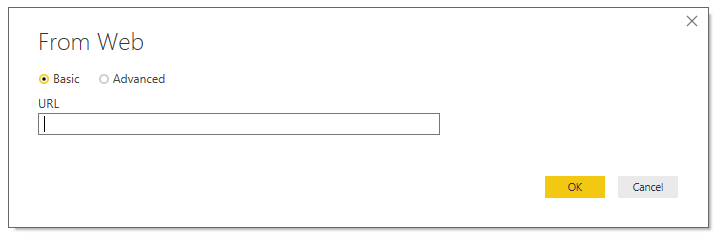
So the question is which URL to use, right? In your Google Sheet file with your advertising data. This is what you need to do:
- Share the file as “Anyone with the link” “Can edit”. Just don’t share the URL with anybody you don’t trust and you will be fine.
- Download each sheet as CSV
- Locate the source URL from which the file was downloaded. Copy it.
- Go back to Power BI and paste the URL into the windows.
- Click OK.
More details about connecting Google Sheets to Power BI/Power Query can be found here.
Ideally, you add each Google Sheet as new data source. It’s the most reliable option. So number of sheets = number of URLs you need = number of data source in Power BI‘s Query Editor. I am starting with Bing Data.
So when you enter the correct URL and press OK, query editor will load:

So now you are in Query Editor which equals to Power Query in Excel. So all articles from this website now apply even to Query Editor in Power BI. (In the image above, you can already see some “APPLIED STEPS” in the right hand side which I did in order to anonymize the data).
In the Query Editor, you can:
- Pre-filter your data
- Create custom columns based on IF conditions (beginners or advanced)
- Easily manipulate text with list functions
- You can create evaluation loops
- Lookup data from 1 query to another one
- Append tables
The points #1-6 represent the main advantages of using Power BI: You can cleanup & transform your data before you get to the stage where you design your dashboards. You cannot do this in Google Data Studio which expect your data to be nice & clean.
Back to Power BI. We now need to add the second source of data – data from AdWords. We need to repeat the procedure for getting the URL to the Google Sheet in question. So navigate to Home Tab>New Source>Web and enter the new Source URL:

New query will load:

The picture shows the result after I did little bit of cleaning: filtered only for specific campaigns, removed Campaign ID column, added Source column…
Now you need to append both tables on the top of each other so we can create queries based on the combined table and split by “Source”. That’s where “Append” functionality becomes handy. Append both queries as new:

Time to close the Query Editor and to start designing your Dashboard. Let’s make something simple:

Let’s create copy of the chart and turn it into a table (CTRL+C, CTRL+V):

Now publish to Power BI online interface:

And final step in Power BI online interface – setting up the scheduling (of course, you need to have your Power BI account activated beforehand):

As you can see, for every refreshable data source (I have just 1 data source in my dataset), you need to provide credentials even in the Power BI online interface. Since my sample Google Sheet doc is shared to “anyone with link”, the “Authentication method” is “Anonymous”.
Few words about the basic terms you see in the images:
- Dataset = source for your Reports. 1 Dataset can be source for multiple Reports.
- Reports = visualized data from your Dataset. 1 Report can use only 1 Dataset as source.
- Dashboard = combination of pages or single visuals from your Reports
Before we conclude, let’s have a look on one of the coolest feature of Power BI visualization (works in Power BI for Desktop and in Power BI online UI as well):

We can see that all the visuals are interconnected. If you select a category in one visual, all other visuals on the same page will get “filtered’ according to your selected category. When I select “Bing” in the chart, even the table starts showing only Bing numbers.
Conclusion
Using Supermetrics for Google Sheets & Power BI is quite uncommon for PPC reporting purposes. The setup is slightly more complicated. At the same time, you need to pay for Power BI license and for Supermetrics license. However, for all this extra complexity & cost, you get extremely flexible reporting solution which allows you to cleanup & transform your data according to your need before you start using the data for visualization. This is something that free & easier to use Google Data Studio cannot offer.
Btw, when you are done, you can easily share you dashboard with public by providing with a link. The sample report from this exercise is here: https://goo.gl/18jeDB
Take action: