Analyzing Auction Insights data from AdWords is painful because you cannot segment the data by campaign. At the same time, the data is not accessible by API. So what if you want to analyze Auction Insights for X campaigns at once? Power Query is here to help. In today’s article, I will provide you with a free tool which can do the heavy lifting for you by combining multiple CSVs with campaign level auction insights data from a folder into a single pivot table.
***Tip: Have a question? Ask in the comment section below or in this Facebook group. You can also sign up for our free newsletter.***
***Do you feel like you need more help? We can help you with PPC Automation and/or with your reporting under our new project MythicalReports.com here.***
The Process
When it comes to processing Auction Insights data efficiently on scale, there are multiple steps involved:
- Download Auction Insights CSVs from AdWords. Number of campaigns you want analyze = number of files you need to download.
- Save the CSVs to a folder (which you can locate). The names of the files need to equal to “{campaign_name}.csv”.
- Download & Setup the Power Query tool. Get it here.
- Create pivot tables you need
- Analyze
Downloading Auction Insights Data from AdWords
The first thing you need to do, is to manually download auction insights data from AdWords on campaign level. The number of campaigns you want to analyze needs to equal to number of the downloaded files. Use campaign names as file names. If your campaign is called “Campaign A” then the file name has to be “Campaign A.csv”. Unfortunately, auction insights data is not available via AdWords API at this point, so we have to download the CSV files manually and there is no way around it this dreadful step.
In AdWords, you can download e. g, “all time” report with “Day” segment, don’t forget to add the segment, it’s important. Adding the “Day” into segment ensures you will be able to see auction data trending in time.

Setting up Power Query Tool
You obviously need to download my tool now – grab it here. (click the download arrow in top right corner on the “next black screen” after you click “here”).
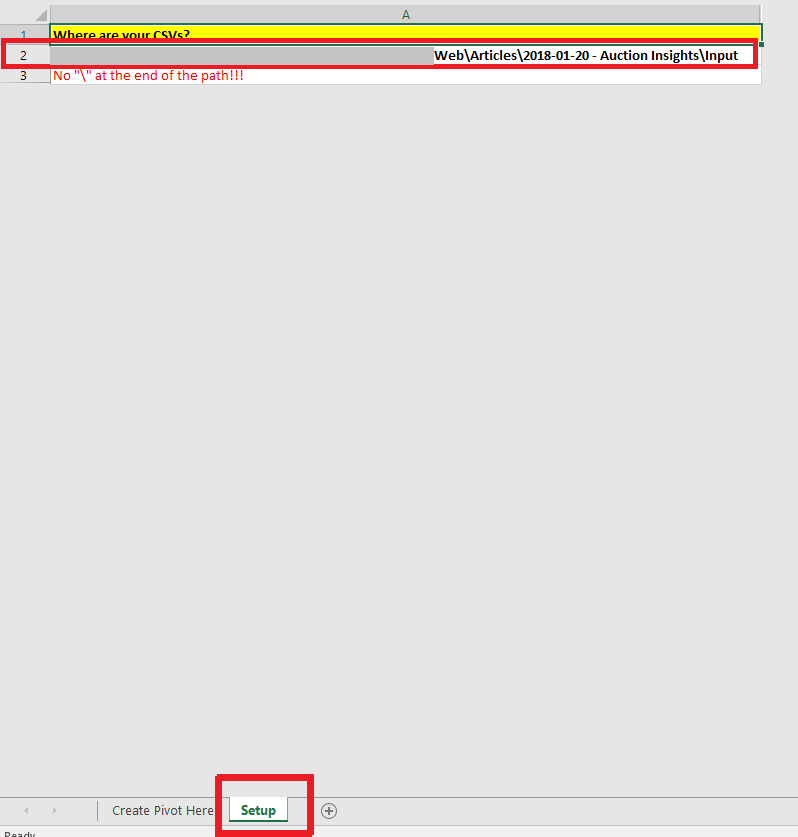
Save the file somewhere to your PC. Then open it, add folder path to the files you just downloaded on the “Setup” sheet.
Creating Pivot Tables
Now it’s time for the cool stuff. You need to create pivot tables by using the background queries as data source. Normally, you would use a range as source but this tool is using queries which are loading the data from the saved CSV files from AdWords.

Notice the “Campaign” dimension, that comes from the CSV file names. This is why it’s important to use campaign names as file names. In my sample, “Display url domain” is grayed out since I cannot share the real competitor names but that’s where you would normally see the competitor names.
Once you have created the pivot, you are limited only by imagination. You can create endless combinations of pivot table designs.
Refreshing the Data Next Time
Next time you want to refresh this report with updated files, you just need to:
- Get fresh files from AdWords, save them to the same folder. Make sure the dates within the CSV files do not overlap. I. e. don’t have performance for campaign A for day X inside more than 1 file.
- Open the Excel file, right click one pivot table and click Refresh.
- Power Query will then go and query the latest files CSV files you just saved.
- That’s it.
Notes
If you downloaded my tool and it’s not working as expected, let me know and I’ll try to fix it. There might be issues with different number formats in different countries but I tried to account for these scenarios. Generally speaking, if you have AdWords in the same language/location settings as your PC, the tool should work. For the record, the tool was built on a PC with United States settings (date format, number format…) and AdWords set to English. If you experience any issues, you can contact me by commenting the article below OR in this Facebook group OR shoot me a direct email to mail@danzrust.cz.
Conclusion
The beauty here is that you can analyze & compare multiple campaigns on scale. The only painful step is to download the CSV files from AdWords. Once you pass this step, it’s just a matter of a click to refresh.
************************************************************************
Bonus: How Does the Tool Work?
If you are interested, you can have a look at how the tool actually works and what it does “in the background”. You don’t have to read or understand this but it’s good to know the trickery behind the tool. You are free to skip this.
This is what happens: After you save the CSV files from AdWords to your input folder, the files are used as data source in to Power Query. To be on the safe side, I am adding ends with “csv” filter to make sure only CSV files are loaded in case there are another junk files in your input folder.

Once the files are loaded, it’s time to “open” them:

Then there are few steps to clean up the data such as “<10%” in the Impressions Share column. I am converting “<10%” to “5%”:

Then the just create new pivot tables based on “Data for Pivots”. You can also have look yourself by going to Power Query in the shared file.
***Tip: Have a question? Ask in the comment section below or in this Facebook group. You can also sign up for our free newsletter.***
***Do you feel like you need more help? We can help you with PPC Automation and/or with your reporting under our new project MythicalReports.com here.***